Is Canada printing proportionately more money than anyone else in the G7?
So, a few days ago, Build Canada produced this chart (below), and I was immediately suspicious. The claim that Canada “prints too much money” is a repeating CPC fallacy, not a serious position. Canada hasn't hit the presses to increase the supply of money for a very, very long time.

The graph appears genuine. It plots the M2 money supply of each G7 country, indexed to March 2004. Look how “bad” Canada is!
The claim
Every G7 country hit the brakes on money printing. Except Canada.
is bunk. Or, at least, the chart doesn’t actually show that.
The chart seems to have originated with Scott Stevenson, who created it in TradingView in March 2026 (below). Within days it had spread through Reddit, Facebook, X, and eventually, it seems, Build Canada.

The problem here isn’t that the graph lies. The problem is that it quietly asks the reader to make a leap the data do not justify.

Even the Creator Clarified His Position
Scott Stevenson later wrote:
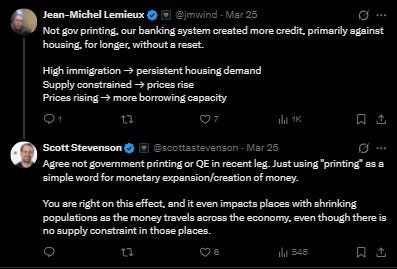
That clarification changes the argument considerably as there’s a significant difference between saying that Canada’s broad money supply continued to expand and that Canada kept printing money.
Most readers interpret “printing money” as governments or central banks creating money. Scott now says that’s not what he meant.
Words matter. Especially when they’re doing most of the persuasive work.
There’s Another Wrinkle
Former deputy finance minister Tyler Meredith caught on.
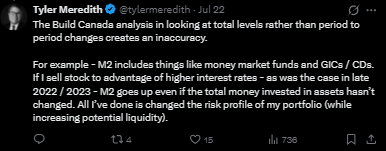
M2 doesn’t only increase when governments or central banks inject money into the economy.
It also changes because people move assets into bank deposits, money-market funds, GICs and other instruments included in M2.
Banks create deposits when they make loans.
Mortgage lending creates money shown in M2.
If Canadians continue taking out enormous mortgages—as they have for years—Canada’s M2 can continue growing even after quantitative easing has ended.
The chart itself cannot distinguish between those causes.
Private lending—not government—is a major source of M2. Most money creation in Canada is private, not public.
Confused?
Well, I don’t blame you.
I excised a lot of criticism in order to keep it this simple.
Know this: The chart is real. The data is real. It's simply not showing Chretien, Martin, Harper, Trudeau and/or Carney revving up the government printing presses. The reason why the Canadian curve edges out the other G7 members is likely because it’s disproportionately affected by Canada’s oversized mortgage market.
Housing is a whole other issue encompassing macroeconomic policy, federal-provincial relationships, and a lot of provincial policy over the ages.
I’m not going there today.

No comments:
Post a Comment